Ontario Curriculum Expectation:
2.D1.5 analyse different sets of data presented in various ways, including in logic diagrams, line plots, and bar graphs, by asking and answering questions about the data and drawing conclusions, then make convincing arguments and informed decisions
Time limit: 0
Activity Summary
0 of 10 questions completed
Questions:
Information
You have already completed this activity. You cannot start it again.
Activity is loading…
You must sign in or sign up to take this activity.
You must first complete the following:
Results
Question results are being recorded.
Results
0 of 10 questions answered correctly
Your Time:
Time has elapsed.
You have reached 0 of 0 point(s), (0)
Score: of ()
0 Essay(s) Pending (Possible Point(s): 0)
Categories
- Not categorized 0%
- 1
- 2
- 3
- 4
- 5
- 6
- 7
- 8
- 9
- 10
- Current
- Review
- Answered
- Correct
- Incorrect
-
1 of 101. Question
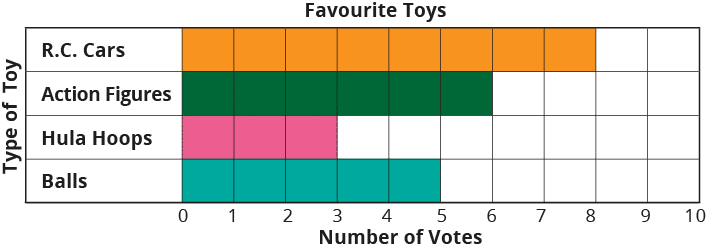
1. What was the most popular toy?
 CorrectIncorrect
 -
2 of 102. Question
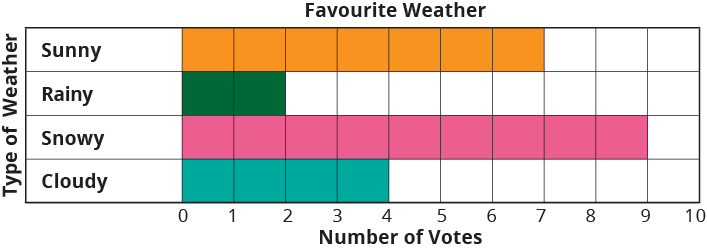
2. How many less children liked rainy weather than cloudy weather?
 CorrectIncorrect
 -
3 of 103. Question
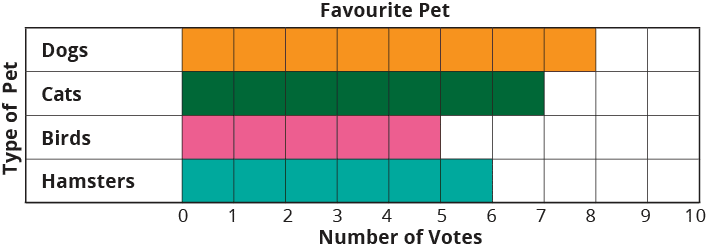
3. What was the least popular pet?
 CorrectIncorrect
 -
4 of 104. Question
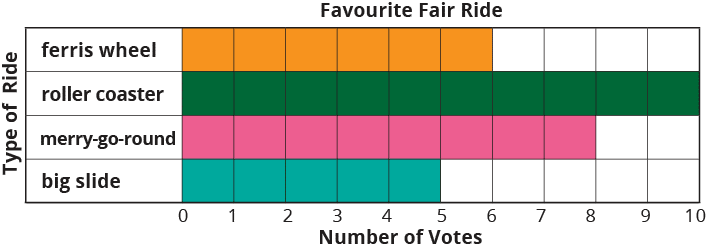
4. How many more children liked the merry-go-round than the big slide?
 CorrectIncorrect
 -
5 of 105. Question
5. How many children liked hopscotch?
 CorrectIncorrect
 -
6 of 106. Question
6. How many children liked action figures?
CorrectIncorrect -
7 of 107. Question
7. What was the most popular type of weather?
CorrectIncorrect -
8 of 108. Question
8. How many more children liked dogs than cats?
CorrectIncorrect -
9 of 109. Question
9. What was the most popular fair ride?
CorrectIncorrect -
10 of 1010. Question
10. How many less children liked skipping than tag?
CorrectIncorrect