Ontario Curriculum Expectation:
6.C2.4 solve inequalities that involve two operations and whole numbers up to 100, and verify and graph the solutions.
An inequality shows the relationship of two expressions when they are compared. Here is an example of an inequality with a variable.
x > 4
x ≤ 4 means x is a value smaller than 4. So there are many possibilities. x can be 0, 1, or 4.
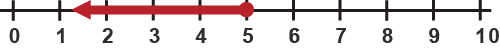
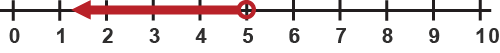
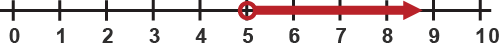
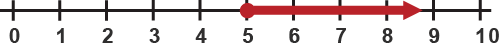
To show these different possibilities, we graph the value on a number line.
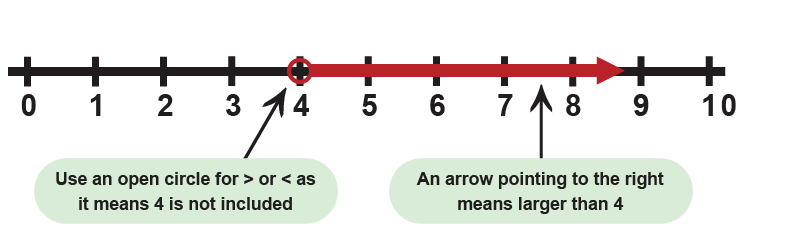
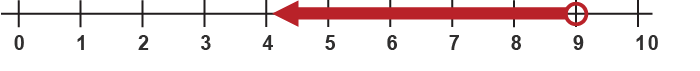
This is the graph of x > 4:
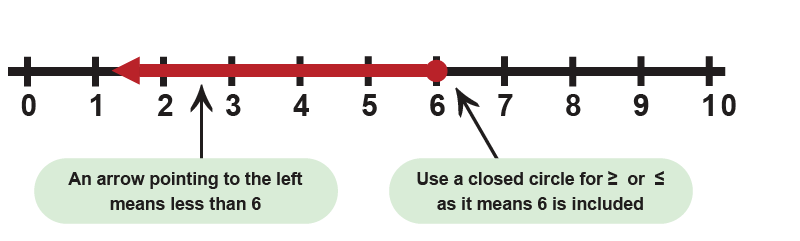
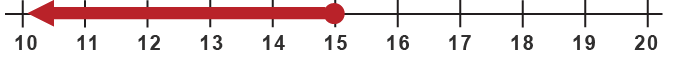
This is the graph of x < 6:
Activity Summary
0 of 20 questions completed
Questions:
Information
You have already completed this activity. You cannot start it again.
Activity is loading…
You must sign in or sign up to take this activity.
You must first complete the following:
Results
Question results are being recorded.
Results
0 of 20 questions answered correctly
Your Time:
Time has elapsed.
You have reached 0 of 0 point(s), (0)
Score: of ()
0 Essay(s) Pending (Possible Point(s): 0)
Categories
- Not categorized 0%
- 1
- 2
- 3
- 4
- 5
- 6
- 7
- 8
- 9
- 10
- 11
- 12
- 13
- 14
- 15
- 16
- 17
- 18
- 19
- 20
- Current
- Review
- Answered
- Correct
- Incorrect
-
1 of 201. Question
1. Match the inequalities to their correct graphs.
-
x < 5
-
x < 5
-
x > 5
-
x < 5
CorrectIncorrect -
-
2 of 202. Question
2. Choose the correct possible values for the variable below.
n < 7
 CorrectIncorrect
 -
3 of 203. Question
3. Choose the correct possible values for the variable below.
n < 9
 CorrectIncorrect
 -
4 of 204. Question
4. Choose the correct possible values for the variable below.
n < 15
 CorrectIncorrect
 -
5 of 205. Question
5. Choose the correct possible values for the variable below.
n > 19
 CorrectIncorrect
 -
6 of 206. Question
6. Choose the correct possible values for the variable below.
n > 28
 CorrectIncorrect
 -
7 of 207. Question
7. Match the inequalities to their correct graphs.
-
n > 4
-
n > 4
CorrectIncorrect -
-
8 of 208. Question
8. Match the inequality to the correct graph.
-
n > 15
-
n < 15
CorrectIncorrect -
-
9 of 209. Question
9. Choose the correct possible values for the variable below.
n < 30
 CorrectIncorrect
 -
10 of 2010. Question
10. What is the correct variable for the graph below?
 CorrectIncorrect
 -
11 of 2011. Question
11. What is the correct variable for the graph below?
 CorrectIncorrect
 -
12 of 2012. Question
12. Choose the correct possible values for the variable below.
n < 0
 CorrectIncorrect
 -
13 of 2013. Question
13. Match the inequality to the correct graph.
-
n < 14
-
n > 14
CorrectIncorrect -
-
14 of 2014. Question
14. What is the correct variable for the graph below?
 CorrectIncorrect
 -
15 of 2015. Question
15. Choose the correct possible values for the variable below.
n < 6
 CorrectIncorrect
 -
16 of 2016. Question
16. What is the correct variable for the graph below?
 CorrectIncorrect
 -
17 of 2017. Question
17. What inequality does the number line show?
 CorrectIncorrect
 -
18 of 2018. Question
18. Choose the correct possible values for the variable below.
n < 20
 CorrectIncorrect
 -
19 of 2019. Question
19. What inequality does the number line show?
 CorrectIncorrect
 -
20 of 2020. Question
20. Match the inequalities to their correct graphs.
-
n < 31
-
n > 31
CorrectIncorrect -